Just how bad are the new Muskrat Falls cost estimates?
The price of electricity is going to rise even more than we thought
There have been some important updates on the Muskrat Falls project recently. Since these have not been clearly explained in the press (partly due to Nalcor spin-doctoring) I have done my own analysis. Bear in mind that all of the information below is derived from Nalcor or government sources, and much of it has been disputed by critics of the project.
Rising costs
The table below shows Nalcor’s capital cost estimates for the project, excluding the Maritime Link (sources: Government Backgrounder, Oversight Report page 14). Each year the price has gone up by about half a billion dollars.
- 2010: $5.0 B – estimate during PUB review
- 2012: $6.2 B – estimate at project sanction
- 2013: $6.5 B
- 2014: $7.0 B
Recall that the Public Utilities Board was asked to make a decision on the project based on the 2010 value. No wonder they complained they didn’t have enough information to make a decision!
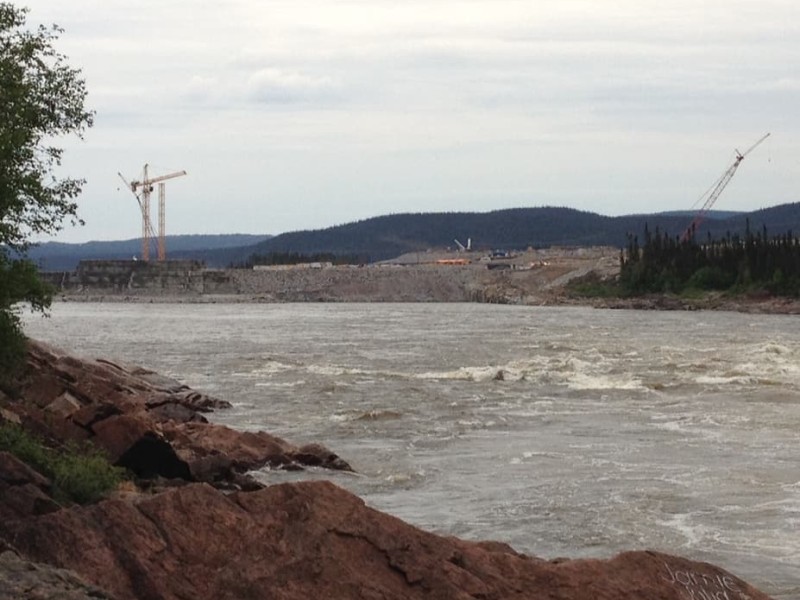
Five months behind schedule
When Muskrat Falls was sanctioned 18 months ago, the target for “First Power” was July 2017. Nalcor now expects First Power in December 2017 — five months late. (Sources: MHI report page 12, Oversight report page 16.)
The price of electricity is going to rise even more than we thought
We will all have to pay for these delays and cost overruns. In the chart below I compare Nalcor’s rate projections for residential customers (excluding Labrador) when the project was sanctioned, versus the latest projections (sources: Nalcor tables, here and here). I’ve also included the electricity rate in 2012, the year the project was sanctioned (source: Nalcor document page 5). (Note: the vertical axis does not start at zero.)

We see that there was always supposed to be a jump in price, but now the jump has gotten significantly larger. We get a better feel for the price projection if we correct for inflation (using 2014 dollars assuming 2 per cent inflation).

The original plan was to pay higher prices until about 2025, after which prices would be lower than in 2012. But Nalcor’s new projection predicts we will be paying inflated prices until 2030 and beyond — a pretty big change.
Over the period from 2018 to 2030, the new projection is on average about 9 per cent higher than the old one. For the average customer using electric heat (using 2,058 kWh per month), this works out to an extra $24 per month for more than a decade.*
Is Muskrat Falls the “least cost option”?
There are several energy alternatives that critics claim are superior to Muskrat Falls (personally, I think Jim Feehan’s proposal to encourage conservation using marginal cost pricing ought to have been more seriously considered). The main alternative considered by Nalcor was the Isolated Island Option, which mainly depends on oil-fuelled power plants, like Holyrood. Here is a comparison of the projected rates, corrected for inflation.**

From this chart it is not clear which option is cheaper. If we look beyond 2030 then Muskrat Falls still holds a clear advantage over the Isolated Island Option, but over the medium term it really could go either way. Government may have been too quick to pull the trigger on this risky and expensive project.
* This figure is much higher than the $8 estimate reported by the CBC. I believe their source was a garbled statement from Ed Martin in which the range $8-to-$28 was given, but poorly explained. I believe their average uses all customers, including those without electric heat (which reduces the estimate by about 25 per cent), and only considers the year 2018 rather than the full period 2018-2030, which reduces the estimate by about 60 per cent and does not account for inflation, which increases the estimate by about 10 per cent.
** Premier Tom Marshall has said that it is unfair to compare the updated cost of Muskrat Falls with the earlier cost estimate of the Isolated Island Option, because cost escalations would have affected both options equally. He is wrong. Muskrat Falls should be thought of as a large construction project that has gotten more expensive due to rising labour costs locally and changes in the design. The cost of the Isolated Island Option mainly depends on the price of oil to fuel the generators, and this is determined by global commodity markets. The main cost drivers of the two options are mostly unrelated.
Editor’s note: If you would like to respond to this or any article on TheIndependent.ca, or if you would like to address an issue we haven’t yet covered, we welcome letters to the editor and consider each of them for publication in our Letters section. You can email yours to: justin at theindependent dot ca. Not all letters will be printed, but all will be read.

Author

Related Articles

The truth about Ed
The former Nalcor CEO has a history of misleading the public on cost overruns at Muskrat Falls. It’s time for an investigation.

Budget thoughts on the eve of austerity
Austerity is unavoidable. How do we minimize the damage?
How to fix the deficit
The province needs to cut spending and raise taxes. But by how much?